


Abstract
Effectively conserving ecosystem services in order to maintain human wellbeing is a global need that requires an understanding of where ecosystem services are produced by ecosystems and where people benefit from these services. However, approaches to effectively identify key locations that have the capacity to supply ecosystem services and actually contribute to meeting human demand for those services are lacking at broad spatial scales. We developed new methods that integrate measures of the capacity of ecosystems to provide services with indicators of human demand and ability to access these services. We then identified important areas for three ecosystem services currently central to protected area management in Canada—carbon storage, freshwater, and nature-based recreation—and evaluated how these hotspots align with Canada's current protected areas and resource development tenures. We find that locations of ecosystem service capacity overlap only weakly (27–36%) with actual service providing areas (incorporating human access and demand). Overlapping hotspots of provision for multiple ecosystem services are also extremely limited across Canada; only 1.2% (∼56 000 km2) of the total ecosystem service hotspot area in Canada consists of overlap between all three ecosystem services. Canada's current protected area network also targets service capacity to a greater degree than provision. Finally, one-half to two-thirds of current ecosystem service hotspots (54–66%) overlap with current and planned resource extraction activities. Our analysis demonstrates how to identify areas where conservation and ecosystem service management actions should be focused to more effectively target ecosystem services to ensure that critical areas for ecosystem services that directly benefit people are conserved. Further development of these methods at national scales to assess ecosystem service capacity and demand and integrate this with conventional biodiversity and conservation planning information will help ensure that both biodiversity and ecosystem services are effectively safeguarded.
Export citation and abstract BibTeX RIS

Original content from this work may be used under the terms of the Creative Commons Attribution 4.0 license. Any further distribution of this work must maintain attribution to the author(s) and the title of the work, journal citation and DOI.
1. Introduction
There is an urgent and growing need worldwide to conserve ecosystem services, and a substantial opportunity to achieve this by ensuring that conservation actions target both biodiversity and ecosystem services. The 2050 vision of the Convention on Biological Diversity (CBD 2010) and the 2020 Aichi Biodiversity Targets (Target 14; CBD 2010) both call for increased efforts to conserve, restore, and safeguard those areas that 'contribute to health, livelihoods, and well-being' and 'deliver benefits essential for all people'. To meet these goals, a necessary first step is to accurately quantify and map services at broad spatial scales to help prioritize key locations for ecosystem service conservation and management. This is especially true for evaluating, managing, and establishing protected areas, which are a central focus of current global biodiversity conservation initiatives.
There continues to be a real need to identify important areas for ecosystem services at national scales because most countries currently emphasize area-based approaches to biodiversity conservation targets (e.g. Aichi Target 11). This is true despite the fact that ecosystem service science has advanced beyond simply pinpointing static locations that provide ecosystem services (e.g. the InVEST, MIMES, and SolVES models) and an increasing awareness that a variety of approaches, including but not limited to protected areas, are necessary to conserve ecosystem services (Goldman et al 2008, Martín-López et al 2011). Unfortunately, while methods to identify key areas for biodiversity are relatively advanced (Mittermeier et al 2011) and are guiding the identification of global Key Biodiversity Areas (KBAs), similar methods for ecosystem services that are relatively straightforward, use freely available data, and account for the different dimensions of service provision are lacking (Xu et al 2017, Keeler et al 2019)
Critical to identifying important areas for ecosystem services is recognizing that ecosystem service provision depends not only on the presence of natural ecosystems and biodiversity that can supply high levels of services, but also on complex interactions between ecosystems and people's needs and abilities to access and utilize that supply (Mace et al 2012). Thus, ecosystem service provision depends on two distinct elements: the capacity of ecosystems to supply a service, and demand for that service by people (Mitchell et al 2015). Where capacity and demand meet, provision can occur. Importantly, the ecosystem service flows that connect capacity and demand are often spatially complex. For example, many ecosystems have the capacity to supply clean water, but freshwater provision only results when human demand for water is present and hydrological connections allow people downstream to access and use upstream capacity (Brauman et al 2007). Currently, our ability to evaluate these spatial flows at broad scales is limited because, despite a substantial increase in attention on service demand, most ecosystem service studies still focus on capacity (Keeler et al 2019, but see Cimon-Morin et al 2014) or simply contrast capacity and demand (Ala-Hulkko et al 2019, Sun et al 2020). Thus, there are very few examples that integrate capacity and demand to identify priority areas for ecosystem service provision (but see Verhagen et al 2017a).
This lack of ability to identify key areas for ecosystem service capacity, demand, and provision, despite a growing focus on ecosystem services by policy-makers, is an important knowledge gap across the globe. For instance, Canada is the second largest country in the world with a protected area network of more than 10 000 reserves and parks covering 12.1% of Canada's land area (1.2 million km2; Government of Canada 2020). However, no identification of important areas for the different dimensions of service provision, national-scale evaluation of any of the ecosystem services protected by Canada's current protected areas, or consideration of the opportunities and challenges around aligning conservation actions with ecosystem services has been completed. In addition, human actions such as land clearing for agriculture and resource extraction activities (e.g. logging and petroleum and mineral extraction) are rapidly and seriously impacting the capacity of ecosystems to provide services in North America and around the world (Barral et al 2020, Allred et al 2015). Information that allows decision-makers to consider where and how natural areas provide benefits to people, and where those benefits might be most threatened by human actions, can help Canada and other countries safeguard ecosystem services and biodiversity and meet rapidly approaching international commitments such as the Aichi Targets (ECCC 2016a).
We conducted a Canada-wide assessment of three key ecosystem services—climate regulation, freshwater, and nature-based recreation (figure 1)—to inform national-scale conservation planning by: (1) identifying hotspots of single and multiple ecosystem service provision, (2) assessing overlap between Canada's current protected area network and these hotspots, and (3) evaluating the potential for spatial conflicts between ecosystem service conservation and natural resource extraction. These three ecosystem services are currently priorities for protected areas establishment and management (Watson et al 2014), widely provided by protected areas in Canada (Schindler and Lee 2010), and ones where national scale data is available. To meet our objectives, we developed new and robust methods that primarily use free, publicly-available datasets to map the relative capacity of ecosystems to supply ecosystem services, access/demand for those services by people, and actual provision of each service when capacity and demand meet.
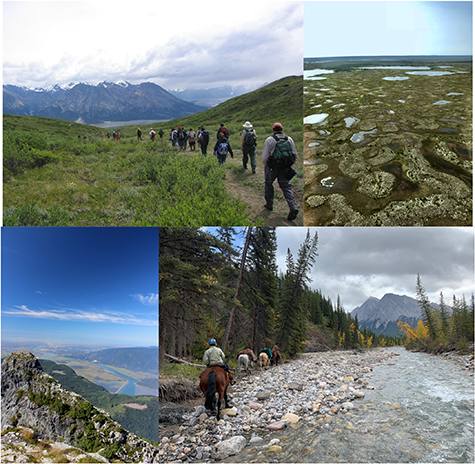
Figure 1. Examples of the ecosystem services in our analysis and key areas for their provision in Canada. (a) Nature-based recreation—Kluane National Park, Yukon; (b) carbon—Hudson Bay lowlands, Ontario; (c) freshwater—Golden Ears Provincial Park, British Columbia, (d) combined ecosystem services—Bighorn Wildland, Alberta. Photo credits: M Mitchell, A Kirkwood, M Mitchell, A Jacob.
Download figure:
Standard image High-resolution image2. Methods
2.1. General approach
We used free, publicly-available spatial data to estimate values of locations across Canada at a 250 m resolution for: (1) capacity to provide ecosystem services; (2) demand for those services by people and their ability to access them; and (3) service provision that results when capacity and demand overlap and people can access the service in question (Tallis et al 2012, Villamagna et al 2013). Detailed methods for each ecosystem service can be found in the appendix.
2.2. Ecosystem service selection
We chose three ecosystem services that align with the predominant uses allowed in most Canadian protected areas (e.g. benign use conducive to maintenance of ecosystem integrity and biodiversity), that are likely to be lost under extractive use (e.g. logging, mining; Crossman et al 2013), and where national scale data are currently available for both capacity and demand. These three services also represent different ways ecosystem service capacity and demand can combine spatially to produce benefits for people and three different service types: regulating (climate regulation), cultural (recreation), and provisioning (freshwater). Ecosystem services more relevant to urban regions (e.g. pollution removal or urban heat island amelioration) or where data were not available (e.g. erosion control) were not included in our analysis. Our assessment of only three ecosystem services is not intended to be a complete decision-making approach for protected areas or conservation planning. Rather, we chose three ecosystem services that allowed us to assess how important quantifying service capacity and demand are for identifying key areas for ecosystem service provision.
2.3. Quantifying and mapping ecosystem services
2.3.1. Climate regulation
We quantified climate regulation capacity by calculating the total amount of carbon stored above- and belowground in each pixel across Canada. Aboveground carbon data came from the Canadian National Forest Inventory (Gillis et al 2005, Beaudoin et al 2014) datasets of total live aboveground biomass (branch, foliage, stem bark, and stem wood) and total dead biomass from 2015 (figures A1(a) and (b) (available online at https://stacks.iop.org/ERL/16/014038/mmedia)). We estimated aboveground carbon by assuming that carbon makes up 48% of the aboveground biomass present (Asner et al 2010). Belowground carbon estimates were obtained from the 2017 SoilGrids system (Hengl et al 2014) dataset that provides soil organic carbon content from 0 m to 1 m depth (figures A1(c) and (d)). We then summed these pixel-level estimates of aboveground and belowground carbon to obtain total carbon store values and then normalized (i.e. min-max scaled) these values between 0 and 1 to calculate relative climate regulation importance. Because carbon stored at any location meets demand for climate regulation globally via atmospheric mixing (Costanza 2008), we assumed global flow of benefits from stored carbon and quantified service provision solely as capacity (i.e. carbon storage).
2.3.2. Freshwater
For freshwater provision we quantified the capacity of natural and semi-natural ecosystems to provide freshwater runoff, estimated the demand for this water by people downstream, and connected capacity to demand by analyzing hydrological connectivity, building on the methods of Ouellet Dallaire (2018). We assumed that upstream natural and semi-natural areas with high runoff (i.e. high capacity) that serve downstream areas with high demand are the most important for freshwater provision (Luck et al 2009). In some cases, high runoff over short periods of time can also contribute to flooding, but data at these fine temporal resolutions are not available for Canada.
We quantified freshwater capacity as the pixel-level modelled amount of annual freshwater runoff using the HydroSHEDS hydrological database. HydroSHEDS data above 60°N were obtained from coauthor BL and are the only data we used that are not publicly available. Water demand was defined as the relative amount of downstream demand from four principal beneficiaries of freshwater in Canada (StatCan 2013, ECCC 2016c): municipal consumption, agriculture, hydropower generation, and industrial activities (factories and thermal power stations). We used proxies for freshwater demand across Canada and hydrologically connected areas of the U.S.A., including the number of people living in downstream settlements larger than 100 people (Balk et al 2006, Global Rural-Urban Mapping Project; Columbia University et al 2011); agricultural surface area (Latifovic and Pouliot 2005); and the number of dams, industrial facilities, and thermal power stations present (NRC 2003, 2010).
To hydrologically connect areas of supply and demand, we created upstream watersheds for each demand pixel. Overlapping demand watersheds were then summed for each upstream pixel and, because demand layers were in different units, normalized between 0 and 1 to calculate relative downstream freshwater demand for each individual demand type. We combined these four demand datasets into a single demand layer, weighting each demand type equally, and again normalized the resulting values. We assigned high values of freshwater provision importance to those areas with high capacity (i.e. high runoff) that are linked to high downstream demand. Additionally, since national scale water quality data in Canada are unavailable, we reduced provision values for croplands, rangelands, and urban areas that are most likely to impact water quality and freshwater provision. Finally, we increased the importance of areas with low capacity but high downstream demand to capture locations that provide critical freshwater to people.
2.3.3. Recreation
We quantified the importance of 'wilderness' or 'nature' for recreation by estimating the potential capacity of areas to provide recreational opportunities based on their naturalness and attractiveness for recreation, and the ability and number of people that could access these areas. We designed our assessment of nature-based recreation provision following the Recreation Opportunity Spectrum (Clark and Stankey 1979) and recreation models and surveys showing people are attracted to highly natural habitats (Peña et al 2015); favour forests, mountains and especially water; and disfavour human disturbed areas such as agricultural lands (Zulian et al 2013).
We estimated the pixel-level capacity for nature-based recreation by combining land cover naturalness, proximity to water features large enough for recreation (waterbodies greater than 10 ha, watercourses with watersheds larger than 100 km2), and presence of mountains (each enhance capacity) with road and population density (each reduce capacity). Naturalness was quantified using a land cover dataset from 2017 (CEC 2017) where urban areas were given a rating of 0, croplands a rating of 0.25, and all other classes (e.g. forests, shrublands, grasslands, wetlands) a rating of 1 (i.e. maximum naturalness). Minimum distance to coastlines, freshwater waterbodies, or watercourses was calculated from Statistics Canada (2016), CanVec Hydrological (NRC 2018), and HydroSHEDS (Lehner et al 2008) datasets, respectively. Mountain ruggedness was calculated using the Terrain Ruggedness Index (TRI) and an elevational dataset for Canada (NRC 2002). Road density was calculated using National Roads Network (StatCan 2015), Statistics Canada (2017), and Open Street Maps (GeoFabrik 2017) road network data. Finally, population density was obtained using LandScan global population density data (Rose et al 2018). We normalized each variable between 0 and 1 and combined them to produce a composite recreation capacity value.
For demand, we estimated the number and ability of people to visit each natural location and derive recreation benefits. We estimated accessibility by road for all pixels across Canada using a distance-decay function dependent on the distance to the nearest road, where access is greatest directly adjacent to roads and declines to zero when a location is 5 km away from the nearest road. Next, we calculated population density as the total number of people in Canada and across the US border within a 500 km buffer around each pixel based on LandScan global population density data (Rose et al 2018), again incorporating a distance-decay function to account for travel distances, times, and crossing international borders (figure A3(g)). Values for road accessibility and population density were then normalized between 0 and 1 and multiplied to calculate a relative value for total recreation demand. While land ownership (e.g. public vs. private land) can also affect the ability of people to access natural locations, we assumed that this would at most have a small effect on our results since the vast majority (89%) of lands in Canada are publicly-owned and most private lands have been modified for agricultural or urban land uses and have low recreation capacity. Further, because our aim was to quantify the potential of areas to provide recreation if conserved (e.g. creation of protected areas or other conservation actions), it was important to consider both public and private lands in our analysis.
Finally, we quantified importance for nature-based recreation provision by multiplying recreation capacity with demand (figure A4), but weighted provision towards areas with the capacity to provide wilderness recreation despite being difficult to access, (i.e. high suitability/naturalness but low accessibility/demand).
2.3.4. Combined ecosystem services
To calculate an index of combined provision for the three ecosystem services evaluated, we summed the relative provision/importance values for each separate service and normalized the resulting values between 0 and 1. This is not meant to suggest that all three services are in reality equally valuable to people or should be weighted equally in all conservation prioritization exercises. However, due to the lack of national-scale data on the relative value of these services to people and the fact that at a national-scale in Canada these three services have been identified as important for conservation, we felt this was a reasonable first approach to identify key areas for combined ecosystem service provision.
2.4. Identifying hotspots and overlaps of ecosystem services, protected areas, and resource tenures
We used a hotspot approach (Egoh et al 2008, Qiu and Turner 2013) to identify areas important for ecosystem service capacity and provision and determine overlap between capacity and provision hotspots. Hotspots were pixels in the upper 20th percentile of values (Qiu and Turner 2013, Xu et al 2017). While we present results from a single hotspot threshold value in the Results, we also explored the sensitivity of our results to changes in this threshold (see below). We feel using the top 20th percentile of values is an effective and simple way to identify areas with a high priority for ecosystem service conservation and communicate this information at a national scale. We overlaid hotspots with a spatial dataset of all protected areas and other conservation areas in Canada to determine the proportion of areas important for service capacity and provision currently within protected areas. Finally, we compiled spatial data on the location of tenures for timber, oil and gas, coal, and minerals, as well as croplands to determine the distribution of ecosystem service hotspots relative to natural resource tenures.
2.5. Sensitivity analysis
We first performed a sensitivity analysis of freshwater supply and nature-based recreation to evaluate how sensitive our methods are to changes in the details and weightings of our ecosystem service equations and the underlying data (see appendix). For each service, we varied the values of variables, strength of weighting, and buffers within which we calculated specific layers, and then assessed differences. A sensitivity analysis for carbon was not possible as the belowground and aboveground carbon store data we used were combined directly without any alterations or weightings. We also explored the sensitivity of our results to different hotspot thresholds, varying this from the upper 5th to 50th percentile of values in increments of 5 (see appendix).
3. Results
In Canada, areas of high ecosystem service capacity are often separate from areas that actually provide benefits to people. Other than for carbon storage, only one-quarter to one-third of provision hotspots overlap with capacity hotspots (recreation: 27%, freshwater: 29%, combined services: 36%) (figure 2(a)-(d)). Thus, our results demonstrate how directly equating ecosystem service capacity to provision does not accurately capture where and how people receive benefits from nature.
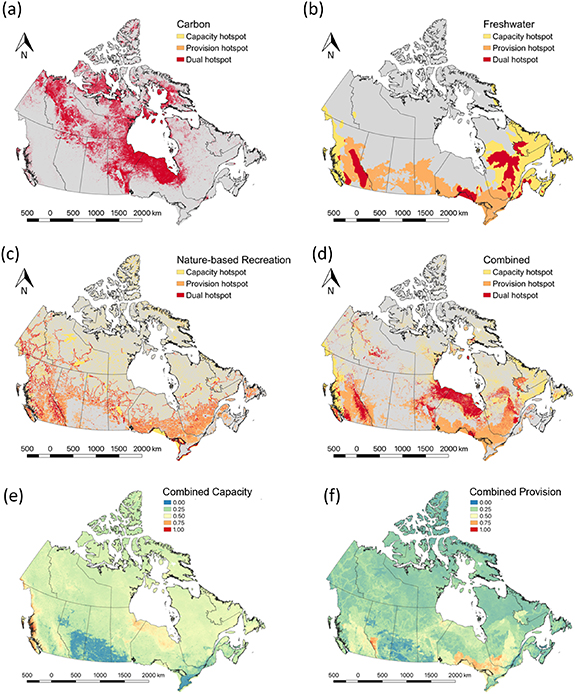
Figure 2. Hotspots (top 20th percentile of values) of ecosystem service capacity (yellow), provision (orange), and both (red) for (a) carbon storage, (b) freshwater, (c) nature-based recreation, and (d) combined ecosystem services, as well as relative importance values for combined ecosystem service (e) capacity and (f) provision across Canada.
Download figure:
Standard image High-resolution imageOur analysis identifies a number of key hotspot areas that should be the focus of conservation actions in Canada for ecosystem services (figure 2(e), (f). This includes the Hudson Bay Lowlands and other boreal shield, taiga, and arctic ecosystems for carbon; North-Central Quebec, Lake Superior, and the eastern mountain ranges of British Columbia for freshwater, and the Lower Great Lakes, central Lakes of Manitoba, and British Columbia-Alberta border for wilderness recreation.
Our analysis also shows that while Canada's protected area network captures service capacity well, it could more efficiently target areas important for ecosystem service provision. The current parks network (figure 3(a)) currently captures between 14%–16% of capacity hotspots, but this falls to 11%–12% for provision hotspots, especially for freshwater (11.2%) and recreation (11.3%; figure 3(b)). These results are even more evident for the federal protected area network, which currently covers about 5% of the country and 3%–7% of capacity hotspots, but only 2%–3% of provision hotspots (figure 3(c)).

Figure 3. (a) Location of protected areas in Canada and coverage of ecosystem service capacity hotspots (top 20th percentile; light green) and provision hotspots (dark green) by (b) Canada's entire protected area network and (c) only protected areas under federal jurisdiction. The dashed lines represent the current areal coverage of Canada's complete protected area and federal protected area networks, respectively.
Download figure:
Standard image High-resolution imageFocusing conservation activities on areas that provide multiple services could help Canada improve ecosystem service conservation, but we find limited hotspot overlap. Whereas individual hotspots of provision for the three services collectively cover 48% of Canada's land base (4.8 million km2), overlapping hotspots of two services only cover 11% (1.1 million km2), and overlapping hotspots of all three services only 0.6% (56 000 km2) (figure 4(a)). In addition, conflicting land use demands for these hotspots make conservation challenging.

Figure 4. (a) Overlap of ecosystem service provision hotspots between carbon, freshwater and nature-based recreation and (b) combined ecosystem service capacity and provision hotspots in Canada outside of current protected areas and resource extraction tenures (petroleum, mining, oil sands and forestry tenures, and croplands).
Download figure:
Standard image High-resolution image
For freshwater and recreation, most people and therefore service demand occurs in southern Canada. This drives overlap between provision hotspots and natural resource tenures. Over half to two-thirds of identified provision hotspots overlap with natural resource tenures (freshwater: 66%; recreation: 63%, combined services: 54%; figure 4(b); table 1). Around half of this overlap involves forest tenures (freshwater: 48%, recreation: 58%, combined services: 50%) while a significant proportion of freshwater provision hotspots (15%) overlaps with croplands. In contrast, since most carbon hotspots exist in northern Canada because of high belowground carbon stocks, only 11% of carbon hotspots overlap with current natural resource tenures.
Table 1. Current coverage of ecosystem service provision hotspots within protected areas and natural resource tenures in Canada in square kilometers.
| Carbon | Freshwater | Recreation | Combined ES | |
|---|---|---|---|---|
| Protected Areas a | ||||
| Nature reserves & wilderness areas | 134 999 (7%) | 34 595 (2%) | 30 308 (2%) | 47 274 (2%) |
| National, provincial & territorial parks | 97 204 (5%) | 127 445 (6%) | 143 411 (7%) | 145 049 (7%) |
| Natural features, species management areas & protected landscapes | 5097 (<1%) | 14 308 (1%) | 13 602 (1%) | 10 590 (1%) |
| Protected areas with sustainable resource use | 2123 (<1%) | 18 843 (1%) | 14 837 (1%) | 16 309 (1%) |
| Unclassified protected areas | 3866 (<1%) | 5822 (<1%) | 1885 (<1%) | 3275 (<1%) |
| Other effective area-based conservation measures (OECMs) | 2542 (<1%) | 22 886 (1%) | 19 259 (1%) | 20 226 (1%) |
| Total | 245 832 (12%) | 223 900 (11%) | 223 302 (11%) | 242 723 (12%) |
| Natural resource tenures | ||||
| Petroleum & natural gas | 18 697 (1%) | 117 553 (6%) | 157 038 (8%) | 84 148 (4%) |
| Mining & coal | 64 614 (3%) | 130 570 (7%) | 152 752 (8%) | 118 633 (6%) |
| Oil sands | 2180 (<1%) | 5171 (<1%) | 34 376 (2%) | 4260 (<1%) |
| Logging | 156 561 (8%) | 964 651 (48%) | 1 152 305 (58%) | 990 849 (50%) |
| Agriculture | 6881 (<1%) | 308 488 (15%) | 0 (0%) | 14 726 (1%) |
| Total b | 223 154 (11%) | 1 314 088 (66%) | 1 247 090 (63%) | 1 058 270 (54%) |
| Remaining hotspot area | 1 544 442 (77%) | 458 279 (23%) | 511 435 (26%) | 677 041 (34%) |
a IUCN protected areas categories used include Ia + Ib, II, III + IV + V, and VI. b Totals sum to less than the individual categories due to spatial overlap of tenures.
Our sensitivity analysis demonstrated that even with fairly significant changes to the underlying assumptions and equations for both freshwater and recreation, only small changes in our results emerged. The most substantial changes we observed occurred when the relative weightings of capacity and demand were altered, but this primarily affected the overlap of capacity and provision hotspots, with little change to the proportion of hotspots protected or threatened. Similarly, changing the hotspot threshold from the upper 20th percentile of values to other thresholds did not result in many substantial changes to our results. For example, the proportion of capacity or provision hotspots protected changed little between the upper 10th to 50th percentile thresholds (but increased considerably with the top 5th percentile), nor did the amount of overlap between ecosystem service hotspots and resource extraction tenures—generally changing at most by 5%. However, the overlap between capacity and provision hotspots increased as the hotspot threshold changed from the top 5th to 50th percentile of values, especially for carbon storage and recreation.
4. Discussion
As Canada and other countries expand their networks of protected areas to meet the Aichi Biodiversity Targets, ensuring that the provision of multiple ecosystem service is conserved, alongside biodiversity, is critical. Similar to KBA and Ecologically or Biologically Significant Marine Area approaches, our analysis helps identify those critical areas that deliver multiple ecosystem services to people. Importantly, our analysis and the lack of overlap in areas important for service capacity versus provision suggests that doing this for some ecosystem services requires the incorporation of the two critical elements of ecosystem services: ecosystem capacity and human demand. This is especially true for services, such as freshwater and recreation, where there are complex spatial flows that connect areas of service capacity to human demand (Serna-Chavez et al 2014, Bagstad et al 2014). While most ecosystem service studies focus primarily on service capacity (Ricketts et al 2016), our results demonstrate that at broad-scales this could at best lead to inefficient strategies for conserving ecosystem services and their benefits, and at worst focus actions on places with the capacity to supply services but that do not currently provide direct benefits to people. This could potentially then lead to the loss of ecosystem service benefits (Watson et al 2019).
Beyond the need to incorporate information on both service capacity and demand, our results also highlight specific enhancements to Canada's conservation decision-making that should occur. First, Canada's current protected area network, and especially the network of federal protected areas (42% by area of the current protected area network), unevenly protects ecosystem service capacity versus provision. As Canada and other countries expand their protected area networks to meet the Aichi Biodiversity Targets, seeking to address this imbalance and improve the protection of areas important for ecosystem service provision should be a key goal. Second, the opportunity for Canada to protect the provision of freshwater and recreation services outside of northern wilderness areas is an important result that could help connect urban populations to nature through urban and rural parks (Andersson et al 2014). In many cases, protected areas creation is focused on places that are marginal for agriculture (Venter et al 2018) or land that lacks competing land uses (Joppa and Pfaff 2009). Although this strategy may allow countries to meet protected area targets (e.g. 25% protected by 2025), our analysis demonstrates that it is unlikely to effectively protect areas that actually deliver direct benefits to people. This is especially true for ecosystem services such as freshwater and recreation where human demand and access are key to realizing service benefits. Ensuring that an increasingly urban population benefits from and values nature is also an increasingly critical conservation strategy in a time of decreasing human connection with nature (Soga and Gaston 2016).
Our analysis also suggests that incorporating ecosystem services into conservation decision-making is likely to be challenging. First, few overlapping hotspots of multiple services exist, and these overlapping hotspots may be even more limited if additional services are considered (Qiu and Turner 2013). Thus, win-win situations where the three services in our analysis can be efficiently conserved and limited conservation resources targeted are limited in Canada. Second, the majority of provision hotspots, especially for freshwater and recreation, overlap with natural resource tenures in the southern half of the country. This is a key result and one that highlights the need for Canada to protect freshwater and recreation services outside of northern wilderness areas. However, effective conservation decision-making and land-use planning for these services will require consultation with a diversity of stakeholders to identify where and how protected areas or other conservation actions should occur to effectively manage ecosystem services. An added benefit of this approach could be increased connections between urban populations and nature through the creation of urban and rural parks (Soga and Gaston 2016).
There is also a critical need worldwide to conserve both biodiversity and ecosystem services. While we did not quantify or include biodiversity in our analysis, we are cognizant of the fact that biodiversity considerations are central to the expansion of protected area networks. Therefore, it will be important to identify locations and management strategies where both can be protected simultaneously (Reyers et al 2012) and also evaluate the consequences of including ecosystem services in conservation planning to ensure that our ability to conserve biodiversity is enhanced. While there is evidence that in some cases key locations for service and biodiversity overlap (Turner et al 2007), this is by no means universal (Naidoo et al 2008) and in some cases prioritizing services as conservation targets might result in suboptimal results for biodiversity conservation (Chan et al 2011). Our methods provide a first step towards accurately including ecosystem services in protected area and conservation planning decisions.
While our analysis provides a promising way to incorporate ecosystem service benefits into conservation planning, by no means does it represent a complete conservation planning framework. Inclusion of information on biodiversity, ecosystem functions, biocultural elements, and additional ecosystem services (e.g. soil retention, flood mitigation) should all be part of a systematic and comprehensive conservation planning approach. Innovative ways to protect areas important for ecosystem services and biodiversity are also required beyond solely creating new protected areas. While our analysis here largely focused on protected areas, it should also help inform where other conservation approaches should be targeted. This includes other effective area-based conservation measures (Dudley et al 2018), conservation designations aimed at sustainably providing ecosystem services (Xu et al 2017, IUCN 2019), partnerships in areas close to human population centres or other heavily disturbed landscapes with private landowners and tenure-holders to implement stewardship projects or conservation easements aimed at increasing the provision of key ecosystem services while conserving local biodiversity (Geertsema et al 2016), Indigenous Protected and Conserved Areas, management guidelines or regulations focused on ecosystem services, and assessments of how human activities inside and outside protected areas and OECMs affect biodiversity and the delivery of ecosystem services (Geneletti 2013). Across these different conservation approaches, our national-scale analysis provides a necessary starting point for the regional- or local-scale work required to identify ecosystem services of particular value to different rights- and stake-holders, understand how different actions will positively and negatively affect a suite of ecosystem services, and develop effective land use plans for conservation.
The abovementioned suite of conservation approaches for ecosystem services also require additional information to be implemented effectively. This includes understanding and evaluating spatial variation in the value of services to people (Klain and Chan 2012) or their ability to access services (Felipe-Lucia et al 2015), especially across different beneficiary groups (Pascual et al 2014, Tashie and Ringold 2019); how future environmental change could affect service capacity and demand (Schröter et al 2005); how reliant different groups are on ecosystem service provision relative to technological alternatives (e.g. freshwater provision versus water filtration and treatment; Ehrlich and Mooney 1983); and uncertainties in ecosystem service mapping (Schulp et al 2014). In particular, understanding the relative value of different services to people will be key to conserving those services most critical to human wellbeing. Unlike our analysis here, these values are unlikely to be consistent across Canada, across groups of stakeholders, or decision-makers. Evaluating the costs, benefits, and likely effectiveness of protected areas versus other measures for conserving ecosystem services will also be required.
Effectively conserving ecosystem services also requires collaborative approaches and recognition that the tangible and intangible benefits people derive from nature are promoted and hindered by different models of natural resource management. The ecosystem service hotspots we identified overlap with the traditional territories of Indigenous people, in addition to natural resource tenures. Conservation strategies that reinforce the dispossession of Indigenous peoples from their ancestral lands and prevent traditional stewardship activities will not be equitable or effective. Conservation must embrace multiple 'ways of knowing' about nature (Ban et al 2018) and commit to active and respectful partnerships between Indigenous and non-Indigenous governments, civil society, and other parties to conserve nature (NAP 2018). This is an opportunity for reconciliation and enhanced ecosystem service and biodiversity protection.
Meeting global ecosystem service and biodiversity related conservation goals requires national-scale conservation plans that develop ecosystem service-specific assessments, evaluate the overlap between biodiversity and service priorities, and integrate this information into decision-making tools and policies that are reflected on the ground (Guerry et al 2015). This data at broad spatial scales is urgently required and increasingly called for. Our results show that incorporating ecosystem capacity and human demand in the assessment of ecosystem services is crucial to help identify locations and opportunities for safeguarding ecosystem service provision. The next challenge is to successfully identify and implement a suite of conservation strategies and actions that effectively safeguard both biodiversity and human wellbeing.
5. Data availability statement
The data that support the findings of this study are available at the following DOI: https://doi.org/10.17605/OSF.IO/KTCXE.
Acknowledgments
We appreciate the constructive input of H Locke, A Woodley, and a number of anonymous reviewers. MM was partially supported by a NSERC postdoctoral fellowship, RS by a Liber Ero fellowship, and DH by a NSERC Vanier Canadian Graduate Scholarship and a PEO Scholars Award. This work was supported by an NSERC Discovery Grant to KC (RGPIN-2015-05105).